OTEL Logging with Grafana Loki and .NET
Logging is an essential part of any application, and Grafana Loki is a solid choice for self hosting your own logging infrastructure. In this post we will setup a new .NET minimal API, and then integrate logging to push to a Loki instance using OTEL (OpenTelemetry).
Creating the .NET API
Let's get started with creating our API, for this we shall use VS Code as the .NET CLI.
dotnet new web -o LoggingApi
cd LoggingApi
code -r ../LoggingApi
Once created let's add the endpoint we will use for our testing. Update the Program.cs file to include the following:
app.MapGet("/log", (ILogger<Program> logger) =>
{
if (logger.IsEnabled(LogLevel.Information))
logger.LogInformation("Logging a message at {time:HH:mm:ss} on {machine}", DateTime.Now, Environment.MachineName);
return Results.Ok();
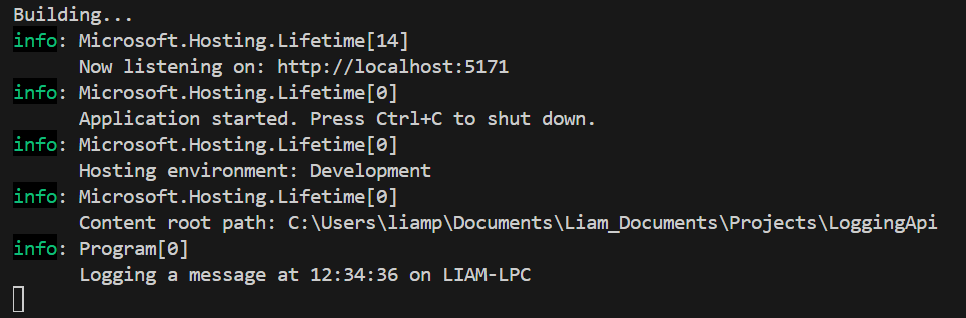
});Let's test this and and make sure everything is good so far, start the application using dotnet run and then navigate to the /log endpoint in your browser. You should see a log in the terminal similar to the image below.
Integrating OTEL Logging
To integrate OTEL logging add the following code before the var app = builder.Build() call.
var useOtlpExporter = !string.IsNullOrWhiteSpace(builder.Configuration["OTEL_EXPORTER_OTLP_ENDPOINT"]);

builder.Logging.AddOpenTelemetry(logging =>
{
    logging.IncludeFormattedMessage = true;
    logging.IncludeScopes = true;

    if (useOtlpExporter)
    {
        logging.AddOtlpExporter();
    }
    else
    {
        Console.WriteLine("OTEL_EXPORTER_OTLP_ENDPOINT is not set. Skipping OTLP exporter configuration.");
    }
});
This will configure our app for OTEL logging, and if a endpoint is set provision an OTEL exporter.
We will need two new packages for this, so add them as below:
dotnet add package OpenTelemetry
dotnet add package OpenTelemetry.Exporter.OpenTelemetryProtocol
Setting up local Grafana + Loki
Next we want to setup a development environment for Grafana, Alloy and Loki, to enable us to test our solution. Grafana is our dashboard and log viewing application, Alloy is the OTEL collector and Loki is the log aggregator.
Create the following files in the root of our project:
services:
  alloy:
    image: grafana/alloy:v1.13.1
    ports:
      - 12345:12345
      - 4317:4317
      - 4318:4318
    volumes:
      - ./config.alloy:/etc/alloy/config.alloy
    command: run --server.http.listen-addr=0.0.0.0:12345 --storage.path=/var/lib/alloy/data /etc/alloy/config.alloy
    depends_on:
      - loki

  loki:
    image: grafana/loki:3.5.10
    volumes:
      - ./loki-config.yaml:/etc/loki/local-config.yaml
      - loki-data:/loki
    command: -config.file=/etc/loki/local-config.yaml

  grafana:
    image: grafana/grafana:12.3
    environment:
      - GF_FEATURE_TOGGLES_ENABLE=grafanaManagedRecordingRules
      - GF_AUTH_ANONYMOUS_ORG_ROLE=Admin
      - GF_AUTH_ANONYMOUS_ENABLED=true
      - GF_AUTH_BASIC_ENABLED=false
    ports:
      - 3001:3000/tcp
    entrypoint:
       - sh
       - -euc
       - |
         mkdir -p /etc/grafana/provisioning/datasources
         cat <<EOF > /etc/grafana/provisioning/datasources/ds.yaml
         apiVersion: 1
         datasources:
         - name: Loki
           type: loki
           access: proxy
           orgId: 1
           url: 'http://loki:3100'
           basicAuth: false
           isDefault: true
           version: 1
           editable: true
         EOF
         /run.sh

volumes:
  loki-data:
compose.yml
otelcol.receiver.otlp "default" {
  http {
    endpoint = "0.0.0.0:4318"
  }
  grpc {
    endpoint = "0.0.0.0:4317"
  }

  output {
    logs    = [otelcol.processor.batch.default.input]
  }
}

otelcol.processor.batch "default" {
  output {
    logs = [otelcol.exporter.otlphttp.loki.input]
  }
}

otelcol.exporter.otlphttp "loki" {
  client {
    endpoint = "http://loki:3100/otlp"
  }
}
config.alloy
auth_enabled: false

server:
  http_listen_port: 3100

common:
  ring:
    instance_addr: 127.0.0.1
    kvstore:
      store: inmemory
  replication_factor: 1
  path_prefix: /loki

schema_config:
  configs:
    - from: 2020-05-15
      store: tsdb
      object_store: filesystem
      schema: v13
      index:
        prefix: index_
        period: 24h

storage_config:
  filesystem:
    directory: /loki/chunks

compactor:
  working_directory: /loki/compactor
  retention_enabled: true
  compaction_interval: 24h
  delete_request_store: filesystem

limits_config:
  retention_period: 720h # 30 days
loki-config.yaml
Once all our files are created spin up services using docker compose up -d . Once started we should be able to access the Grafana interface on http://localhost:3001.
Testing our Setup
To test our logging setup add the following values to our appsettings.Development.json :
{
  // ...
  "OTEL_EXPORTER_OTLP_ENDPOINT": "http://localhost:4317",
  "OTEL_SERVICE_NAME": "LoggingApi"
}
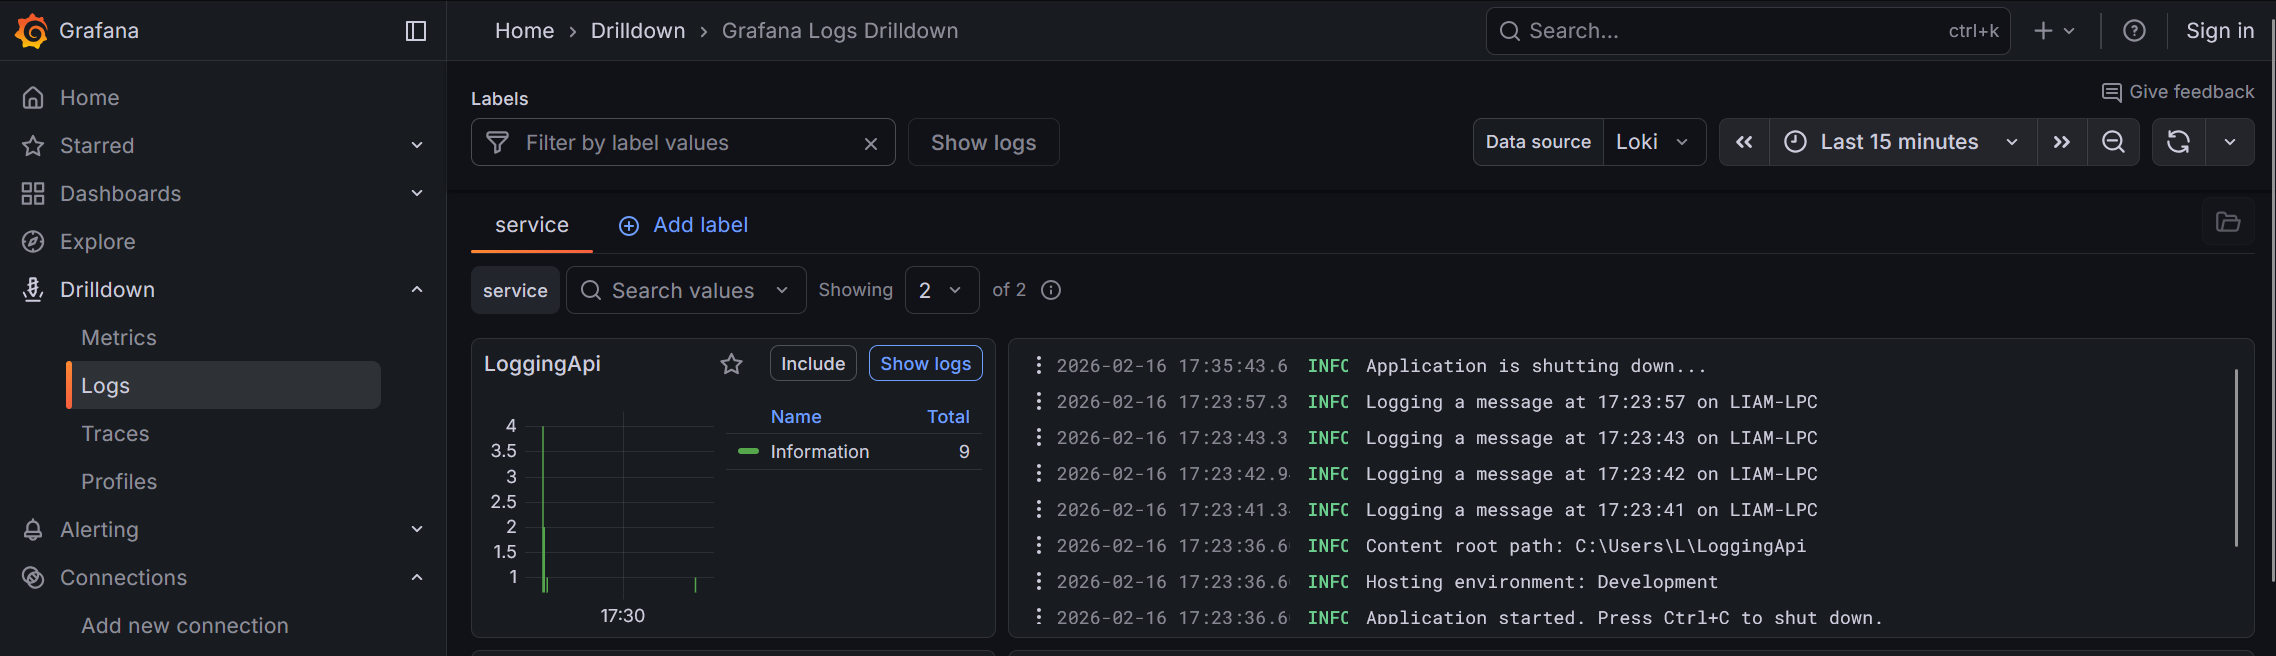
Start our program with dotnet run and then navigate to the /log endpoint in your browser (or a tool such as Postman). You should see the login in the terminal console, and, if you navigate to Drilldown > Logs in the Grafana UI you should see the log messages there.
Conclusion
Using the above steps we can setup a simple logging environment for our .NET application, if we wanted too this could be extended to also support metrics and traces in the future.
The source code for this blog can be found at: https://liamsgit.dev/LiamPietralla/dotnet-loki-otel-demo

